Handling data in nussl
nussl comes with a bunch of different useful dataset hooks, along with a handy base class for datasets. Let’s examine what the base class looks like first.
BaseDataset
The BaseDataset is an abstract class that has a few useful functions for organizing your data. If you call it, directly, however, it will error out:
[1]:
import nussl
import numpy as np
import matplotlib.pyplot as plt
import time
start_time = time.time()
folder = 'ignored'
base_dataset = nussl.datasets.BaseDataset(folder)
---------------------------------------------------------------------------
NotImplementedError Traceback (most recent call last)
<ipython-input-1-ee86740f50fb> in <module>
7
8 folder = 'ignored'
----> 9 base_dataset = nussl.datasets.BaseDataset(folder)
~/Dropbox/research/nussl_refactor/nussl/datasets/base_dataset.py in __init__(self, folder, transform, sample_rate, stft_params, num_channels, strict_sample_rate, cache_populated)
67 num_channels=None, strict_sample_rate=True, cache_populated=False):
68 self.folder = folder
---> 69 self.items = self.get_items(self.folder)
70 self.transform = transform
71
~/Dropbox/research/nussl_refactor/nussl/datasets/base_dataset.py in get_items(self, folder)
131 list: list of items that should be processed
132 """
--> 133 raise NotImplementedError()
134
135 def __len__(self):
NotImplementedError:
For the dataset to work, two functions must be implemented:
self.get_items: A function that grabs all the items that you will need to process.self.process_item: A function that processes a single item.
Let’s build a dataset that returns sums of sine wavs at random frequencies.
[2]:
def make_sine_wave(freq, sample_rate, duration):
dt = 1 / sample_rate
x = np.arange(0.0, duration, dt)
x = np.sin(2 * np.pi * freq * x)
return x
class SineWaves(nussl.datasets.BaseDataset):
def get_items(self, folder):
# ignore folder and return a list
# 100 items in this dataset
items = list(range(100))
return items
def process_item(self, item):
# we're ignoring items and making
# sums of random sine waves
sources = {}
freqs = []
for i in range(3):
freq = np.random.randint(110, 1000)
freqs.append(freq)
_data = make_sine_wave(freq, self.sample_rate, 2)
# this is a helper function in BaseDataset for
# making an audio signal from data
signal = self._load_audio_from_array(_data)
sources[f'sine{i}'] = signal * 1/3
mix = sum(sources.values())
metadata = {
'frequencies': freqs
}
output = {
'mix': mix,
'sources': sources,
'metadata': metadata
}
return output
The primary thing to note here is the format of what is output by the process_item function. It is a dictionary and must always be a dictionary. The dictionary contains three keys: mix, sources, and metadata. sources is similarly not a list but a dictionary. The sum of the values of sources adds up to mix.
Great, now let’s use this dataset.
[3]:
folder = 'ignored'
sine_wave_dataset = SineWaves(folder, sample_rate=44100)
item = sine_wave_dataset[0]
item
[3]:
{'mix': <nussl.core.audio_signal.AudioSignal at 0x7fe6d592c690>,
'sources': {'sine0': <nussl.core.audio_signal.AudioSignal at 0x7fe6d592c2d0>,
'sine1': <nussl.core.audio_signal.AudioSignal at 0x7fe6d592c5d0>,
'sine2': <nussl.core.audio_signal.AudioSignal at 0x7fe6d592c310>},
'metadata': {'frequencies': [161, 536, 693]}}
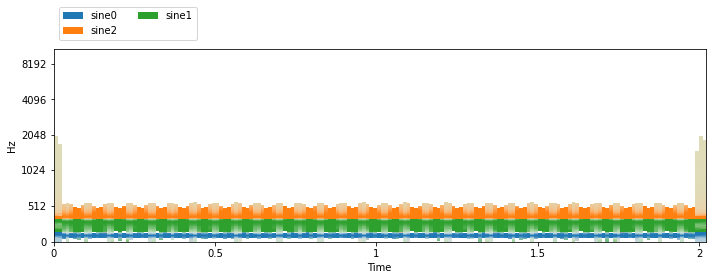
We can see that getting an item from the dataset resulted in a dictionary containing AudioSignal objects! And the exact frequencies for each sine tone were saved in the metadata. Now, let’s listen and visualize:
[4]:
def visualize_and_embed(sources, y_axis='mel'):
plt.figure(figsize=(10, 4))
plt.subplot(111)
nussl.utils.visualize_sources_as_masks(
sources, db_cutoff=-60, y_axis=y_axis)
plt.tight_layout()
plt.show()
nussl.play_utils.multitrack(sources, ext='.wav')
visualize_and_embed(item['sources'])
The STFT parameters were inferred from the first time we used the dataset based on the audio signal’s sample rate and the defaults in nussl. To enforce a specific STFT parameter, we can do the following:
[5]:
folder = 'ignored'
stft_params = nussl.STFTParams(window_length=256, hop_length=64)
sine_wave_dataset = SineWaves(folder, sample_rate=44100, stft_params=stft_params)
item = sine_wave_dataset[0]
visualize_and_embed(item['sources'])
print('STFT shape:', item['mix'].stft().shape)
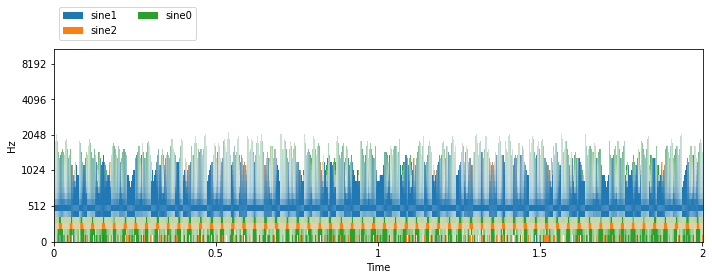
STFT shape: (129, 1380, 1)
Cool! Now let’s look at some of the built-in dataset hooks that ship with nussl.
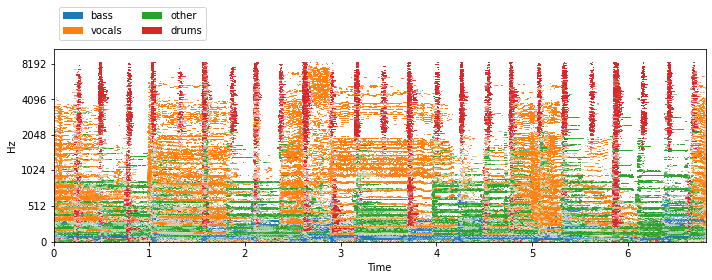
MUSDB18
MUSDB18 is a dataset for music source separation research. The full dataset is available here, but there is a useful functionality where if you don’t have, 7-second clips of each track will be downloaded automatically. In nussl, these get downloaded to ~/.nussl/musdb18. Let’s set up a MUSDB18 dataset object and visualize/listen to an item from the dataset:
[6]:
musdb = nussl.datasets.MUSDB18(download=True)
i = 40 #or get a random track like this: np.random.randint(len(musdb))
item = musdb[i]
mix = item['mix']
sources = item['sources']
visualize_and_embed(sources)
MixSourceFolder
Imagine you have a dataset with the following (somewhat common) structure:
data/
mix/
[file0].wav
[file1].wav
[file2].wav
...
[label0]/
[file0].wav
[file1].wav
[file2].wav
...
[label1]/
[file0].wav
[file1].wav
[file2].wav
...
[label2]/
[file0].wav
[file1].wav
[file2].wav
...
...
This structure is how popular speech separation datasets such as wsj0-2mix and WHAM are organized. Each folder contains isolated sources. The mix folder contains the sum of all the isolated sources that have the same name. So in the above: mix/[file0].wav is constructed from [label0]/[file0].wav, [label1]/[file0].wav, [label2]/[file0].wav.
To use this dataset, we first need to construct a folder with a structure that looks like this. Let’s grab a zip file containing some isolated speakers from file zoo and make one:
[7]:
import os
import zipfile
import glob
import random
def _unzip(path_to_zip, target_path):
with zipfile.ZipFile(path_to_zip, 'r') as zip_ref:
zip_ref.extractall(target_path)
def toy_datasets(_dir):
dataset_locations = {}
keys = ['babywsj_oW0F0H9.zip']
for k in keys:
target_folder = os.path.join(_dir, os.path.splitext(k)[0])
data = nussl.efz_utils.download_benchmark_file(k, _dir)
_unzip(data, target_folder)
dataset_locations[k] = target_folder
return dataset_locations
def make_mix_source_folder(toy_datasets, _dir):
wsj_sources = toy_datasets['babywsj_oW0F0H9.zip']
audio_files = glob.glob(
f"{wsj_sources}/**/*.wav", recursive=True)
n_sources = 2
n_mixtures = 5
_dir = os.path.join(_dir, 'mix_source_folder')
for i in range(n_mixtures):
sources = []
for n in range(n_sources):
path = random.choice(audio_files)
source = nussl.AudioSignal(path)
sources.append(source)
min_length = min([s.signal_length for s in sources])
for n in range(n_sources):
output_path = os.path.join(_dir, f's{n}', f'{i}.wav')
os.makedirs(os.path.dirname(output_path), exist_ok=True)
sources[n].truncate_samples(min_length)
sources[n].write_audio_to_file(output_path)
mix = sum(sources)
output_path = os.path.join(_dir, 'mix', f'{i}.wav')
os.makedirs(os.path.dirname(output_path), exist_ok=True)
mix.write_audio_to_file(output_path)
return _dir
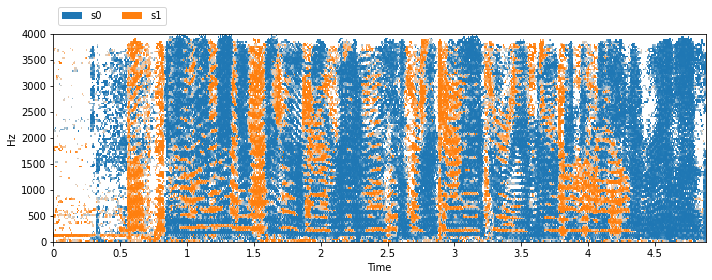
The functions above download a zip file containing isolated speakers, find all the audio files in the unzipped folder, and remix them into a MixSourceFolder-style dataset. Let’s look at some items from this dataset:
[8]:
target_dir = os.path.expanduser('~/.nussl/tutorial/')
source_data = toy_datasets(target_dir)
folder = make_mix_source_folder(source_data, target_dir)
msf = nussl.datasets.MixSourceFolder(folder)
item = msf[0]
sources = item['sources']
visualize_and_embed(sources, y_axis='linear')
Matching file found at /home/pseetharaman/.nussl/tutorial/babywsj_oW0F0H9.zip, skipping download.
And let’s look at the tree structure of the folder:
[9]:
!tree {folder}
/home/pseetharaman/.nussl/tutorial/mix_source_folder
├── mix
│ ├── 0.wav
│ ├── 1.wav
│ ├── 2.wav
│ ├── 3.wav
│ └── 4.wav
├── s0
│ ├── 0.wav
│ ├── 1.wav
│ ├── 2.wav
│ ├── 3.wav
│ └── 4.wav
└── s1
├── 0.wav
├── 1.wav
├── 2.wav
├── 3.wav
└── 4.wav
3 directories, 15 files
WHAM!
The WHAM! dataset is built off of the Wall Street Journal dataset, which contains many hours of isolated speech. The folder structure is the same as MixSourceFolder. WHAM can be hooked into a dataset via:
nussl.datasets.WHAM(folder_where_wham_is, sample_rate=[8000 or 16000])
Look at the associated API documentation for more details.
Scaper
Scaper is a tool for creating complex soundscapes containing multiple isolated sources. nussl has a hook for Scaper that can be used to create a dataset from any folder containing data generated by Scaper. Let’s make some data using Scaper and then point nussl.datasets.Scaper at it. We’ll start by downloading some data straight from the Scaper github.
[10]:
import scaper
import os
import zipfile
import subprocess
# Download the audio automatically
url = "https://github.com/justinsalamon/scaper/archive/v1.2.0.zip"
download_path = os.path.expanduser('~/.nussl/tutorial/scaper')
if not os.path.exists(download_path):
subprocess.run(f'wget {url}', shell=True)
subprocess.run(f'unzip v1.2.0.zip', shell=True)
os.makedirs(download_path, exist_ok=True)
subprocess.run(f'cp -r scaper-1.2.0/tests/data/audio {download_path}', shell=True)
subprocess.run(f'rm -rf scaper-1.2.0/', shell=True)
subprocess.run(f'rm -rf v1.2.0.zip', shell=True)
Here’s what got downloaded:
[11]:
!tree {download_path}
/home/pseetharaman/.nussl/tutorial/scaper
├── audio
│ ├── background
│ │ ├── park
│ │ │ └── 268903__yonts__city-park-tel-aviv-israel.wav
│ │ ├── restaurant
│ │ │ └── 207208__jormarp__high-street-of-gandia-valencia-spain_trimmed.wav
│ │ └── street
│ │ ├── 150993__saphe__street-scene-1.wav
│ │ └── 173955__saphe__street-scene-3_trimmed.wav
│ └── foreground
│ ├── car_horn
│ │ ├── 17-CAR-Rolls-Royce-Horn-2.wav
│ │ └── 17-CAR-Rolls-Royce-Horn.wav
│ ├── human_voice
│ │ ├── 42-Human-Vocal-Voice-all-aboard_edit.wav
│ │ ├── 42-Human-Vocal-Voice-taxi-1_edit.wav
│ │ └── 42-Human-Vocal-Voice-taxi-2_edit.wav
│ └── siren
│ └── 69-Siren-1.wav
└── generated
├── 0.jams
├── 0.wav
├── 0_events
│ ├── background0_park.wav
│ ├── foreground0_siren.wav
│ ├── foreground1_siren.wav
│ └── foreground2_human_voice.wav
├── 1.jams
├── 1.wav
├── 1_events
│ ├── background0_park.wav
│ ├── foreground0_siren.wav
│ ├── foreground1_car_horn.wav
│ └── foreground2_siren.wav
├── 2.jams
├── 2.wav
├── 2_events
│ ├── background0_park.wav
│ ├── foreground0_siren.wav
│ ├── foreground1_siren.wav
│ └── foreground2_siren.wav
├── 3.jams
├── 3.wav
├── 3_events
│ ├── background0_park.wav
│ ├── foreground0_siren.wav
│ ├── foreground1_siren.wav
│ └── foreground2_human_voice.wav
├── 4.jams
├── 4.wav
└── 4_events
├── background0_park.wav
├── foreground0_car_horn.wav
├── foreground1_siren.wav
└── foreground2_human_voice.wav
15 directories, 40 files
Now, let’s use Scaper to make some interesting soundscapes! Note that to use Scaper, you’ll need to have both sox and ffmpeg installed. These can’t be packaged directly with Scaper or with nussl, so be sure to figure out how to do this on your machine.
[12]:
path_to_audio = os.path.join(download_path, 'audio')
output_folder = os.path.join(download_path, 'generated')
os.makedirs(output_folder, exist_ok=True)
soundscape_duration = 10.0
seed = 123
num_mixtures = 5
foreground_folder = os.path.join(path_to_audio, 'foreground')
background_folder = os.path.join(path_to_audio, 'background')
sc = scaper.Scaper(soundscape_duration,
foreground_folder,
background_folder,
random_state=seed)
sc.ref_db = -20
sc.add_background(label=('const', 'park'),
source_file=('choose', []),
source_time=('const', 0))
sc.add_event(label=('const', 'siren'),
source_file=('choose', []),
source_time=('const', 0),
event_time=('uniform', 0, 9),
event_duration=('truncnorm', 3, 1, 0.5, 5),
snr=('normal', 10, 3),
pitch_shift=('uniform', -2, 2),
time_stretch=('uniform', 0.8, 1.2))
for _ in range(2):
sc.add_event(label=('choose', []),
source_file=('choose', []),
source_time=('const', 0),
event_time=('uniform', 0, 9),
event_duration=('truncnorm', 3, 1, 0.5, 5),
snr=('normal', 10, 3),
pitch_shift=None,
time_stretch=None)
for i in range(num_mixtures):
audiofile = os.path.join(output_folder, f'{i}.wav')
jamsfile = os.path.join(output_folder, f'{i}.jams')
sc.generate(audiofile, jamsfile,
allow_repeated_label=True,
allow_repeated_source=True,
reverb=None,
disable_sox_warnings=True,
no_audio=False,
save_isolated_events=True) # this is important!
/home/pseetharaman/.conda/envs/nussl-refactor/lib/python3.7/site-packages/scaper/core.py:1348: ScaperWarning: human_voice event duration (2.59) is greater that source duration (1.54), changing to 1.54
ScaperWarning)
/home/pseetharaman/.conda/envs/nussl-refactor/lib/python3.7/site-packages/scaper/core.py:1348: ScaperWarning: car_horn event duration (3.55) is greater that source duration (1.29), changing to 1.29
ScaperWarning)
/home/pseetharaman/.conda/envs/nussl-refactor/lib/python3.7/site-packages/scaper/core.py:1348: ScaperWarning: human_voice event duration (4.79) is greater that source duration (0.81), changing to 0.81
ScaperWarning)
/home/pseetharaman/.conda/envs/nussl-refactor/lib/python3.7/site-packages/scaper/core.py:1348: ScaperWarning: human_voice event duration (3.19) is greater that source duration (0.81), changing to 0.81
ScaperWarning)
/home/pseetharaman/.conda/envs/nussl-refactor/lib/python3.7/site-packages/scaper/core.py:1348: ScaperWarning: car_horn event duration (3.93) is greater that source duration (1.29), changing to 1.29
ScaperWarning)
The warnings are normal - Scaper is just adjusting the bounds so that things work out when creating the sound scene. Let’s look at what got generated by Scaper:
[13]:
!tree {output_folder}
/home/pseetharaman/.nussl/tutorial/scaper/generated
├── 0.jams
├── 0.wav
├── 0_events
│ ├── background0_park.wav
│ ├── foreground0_siren.wav
│ ├── foreground1_siren.wav
│ └── foreground2_human_voice.wav
├── 1.jams
├── 1.wav
├── 1_events
│ ├── background0_park.wav
│ ├── foreground0_siren.wav
│ ├── foreground1_car_horn.wav
│ └── foreground2_siren.wav
├── 2.jams
├── 2.wav
├── 2_events
│ ├── background0_park.wav
│ ├── foreground0_siren.wav
│ ├── foreground1_siren.wav
│ └── foreground2_siren.wav
├── 3.jams
├── 3.wav
├── 3_events
│ ├── background0_park.wav
│ ├── foreground0_siren.wav
│ ├── foreground1_siren.wav
│ └── foreground2_human_voice.wav
├── 4.jams
├── 4.wav
└── 4_events
├── background0_park.wav
├── foreground0_car_horn.wav
├── foreground1_siren.wav
└── foreground2_human_voice.wav
5 directories, 30 files
So, there are three things per generated mix. The wav file which contains the audio of the mixture, the jams file which contains information about the soundscape, and the _events folder, which contains the audio for each isolated event. Let’s load this folder into nussl.
[14]:
sca = nussl.datasets.Scaper(output_folder)
item = sca[0]
sources = item['sources']
visualize_and_embed(sources, y_axis='mel')
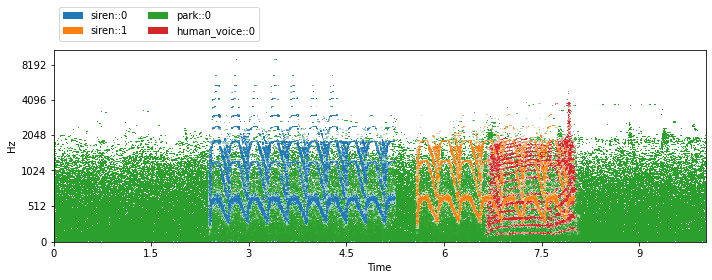
For all the cool things you can do with Scaper, check out the Scaper docs!
Transforms
nussl also provides a “transform” API, akin to the ones found in torchvision. These transforms consume dictionaries produced by a dataset or by other transforms. Let’s use one of them now: SumSources, to transform the output of MUSDB18 by grouping some of the sources together.
[15]:
tfm = nussl.datasets.transforms.SumSources([
['vocals', 'other'], ['drums', 'bass']
])
musdb = nussl.datasets.MUSDB18(download=True, transform=tfm)
i = 40 #or get a random track like this: np.random.randint(len(musdb))
item = musdb[i]
mix = item['mix']
sources = item['sources']
visualize_and_embed(sources)
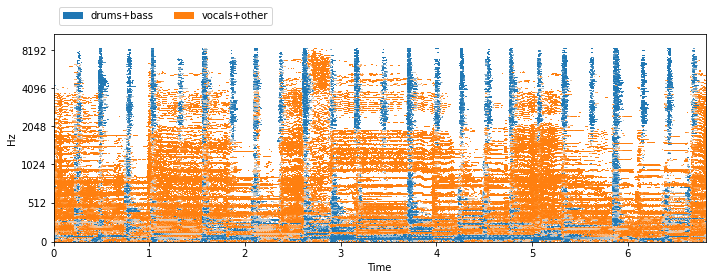
The sources are now grouped according to the SumSources transform. If you’re using datasets in a machine learning pipeline, then you may also want direct access to actual spectrograms of each source. Let’s use another transform to get that, the PhaseSensitiveSpectrumApproximation transform:
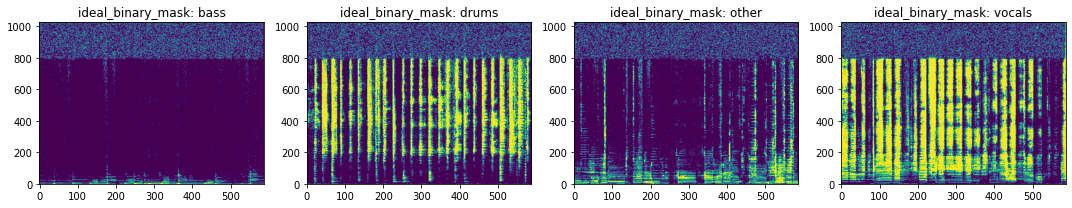
[16]:
tfm = nussl.datasets.transforms.PhaseSensitiveSpectrumApproximation()
musdb = nussl.datasets.MUSDB18(download=True, transform=tfm)
i = 40 #or get a random track like this: np.random.randint(len(musdb))
item = musdb[i]
mix = item['mix']
sources = item['sources']
print(item.keys())
dict_keys(['mix', 'sources', 'metadata', 'index', 'mix_magnitude', 'ideal_binary_mask', 'source_magnitudes'])
The transform added some additional keys to the dictionary:
mix_magnitude: the magnitude spectrogram of the mixturesource_magnitudes: the magnitude spectrograms of each sourceideal_binary_mask: the ideal binary mask for each source
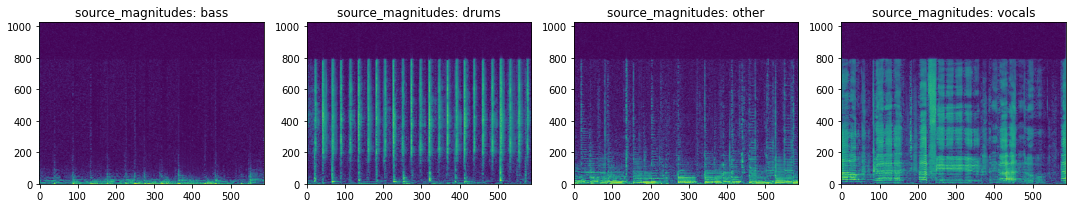
Let’s take a look at some of these:
[17]:
num_frequencies, num_time, num_channels, num_sources = item['source_magnitudes'].shape
print(
f"Shape of 'source_magnitudes': {item['source_magnitudes'].shape}\n"
f"Number of frequencies: {num_frequencies}\n"
f"Number of frames: {num_time}\n"
f"Number of audio channels: {num_channels}\n"
f"Number of sources: {num_sources}\n"
)
keys = ['ideal_binary_mask', 'source_magnitudes']
source_names = sorted(item['sources'].keys())
for key in keys:
plt.figure(figsize=(15, 3))
for i in range(item[key].shape[-1]):
plt.subplot(141 + i)
plt.imshow(
20 * np.log10(
1e-7 + item[key][..., 0, i]),
origin='lower', aspect='auto'
)
plt.title(f'{key}: {source_names[i]}')
plt.tight_layout()
plt.show()
Shape of 'source_magnitudes': (1025, 587, 2, 4)
Number of frequencies: 1025
Number of frames: 587
Number of audio channels: 2
Number of sources: 4
Note that the order of the sources in the stacked array is in sorted order of the keys for each source. Now, what if we want to group the two operations together by applying both transforms to the item? To do this, we can use the Compose transform:
[18]:
tfm = nussl.datasets.transforms.Compose([
nussl.datasets.transforms.SumSources([
['vocals', 'other'], ['drums', 'bass']]),
nussl.datasets.transforms.PhaseSensitiveSpectrumApproximation(),
])
musdb = nussl.datasets.MUSDB18(download=True, transform=tfm)
i = 40 #or get a random track like this: np.random.randint(len(musdb))
item = musdb[i]
mix = item['mix']
sources = item['sources']
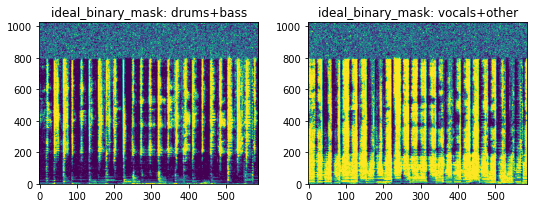
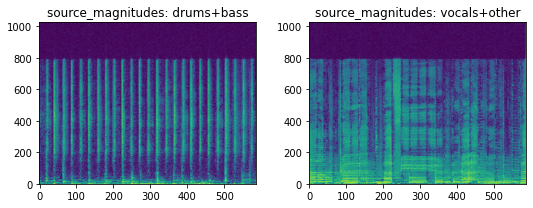
This applied both transforms in sequence. First the sources are summed, then the spectrograms and masks of the resultant summmed sources are computed. Here’s the result:
[19]:
num_frequencies, num_time, num_channels, num_sources = item['source_magnitudes'].shape
print(
f"Shape of 'source_magnitudes': {item['source_magnitudes'].shape}\n"
f"Number of frequencies: {num_frequencies}\n"
f"Number of frames: {num_time}\n"
f"Number of audio channels: {num_channels}\n"
f"Number of sources: {num_sources}\n"
)
keys = ['ideal_binary_mask', 'source_magnitudes']
source_names = sorted(item['sources'].keys())
for key in keys:
plt.figure(figsize=(15, 3))
for i in range(item[key].shape[-1]):
plt.subplot(141 + i)
plt.imshow(
20 * np.log10(
1e-7 + item[key][..., 0, i]),
origin='lower', aspect='auto'
)
plt.title(f'{key}: {source_names[i]}')
plt.tight_layout()
plt.show()
Shape of 'source_magnitudes': (1025, 587, 2, 2)
Number of frequencies: 1025
Number of frames: 587
Number of audio channels: 2
Number of sources: 2
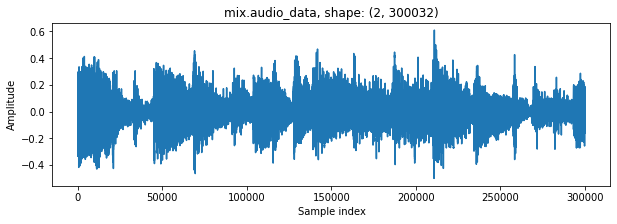
Finally, all datasets just return dictionaries containing AudioSignal objects. Grabbing the audio data is as simple as:
[20]:
plt.figure(figsize=(10, 3))
plt.plot(mix.audio_data[0])
plt.title(f'mix.audio_data, shape: {mix.audio_data.shape}')
plt.xlabel('Sample index')
plt.ylabel('Amplitude')
plt.show()
Accessing the STFT can be done by:
[21]:
mix.stft().shape
[21]:
(1025, 587, 2)
If you so choose, you can use nussl datasets in your own machine learning pipeline instead of using nussl features. However, if you want to use nussl for training a deep model, read on to the next tutorial!
[22]:
end_time = time.time()
time_taken = end_time - start_time
print(f'Time taken: {time_taken:.4f} seconds')
Time taken: 88.5380 seconds